This project began as my final project for GIS-1 and Remote Sensing (Monsoon 2023), a course in the Environmental Studies department at Ashoka University taught by Prof. Meghna Agarwala. It asks a simple question: can freely available satellite radar show where buildings in Gaza were damaged in the first weeks of the war that began in October 2023?
At Prof. Agarwala’s invitation, I later presented it as a poster at the International Meeting on Land-Cover/Land-Use Change (LCLUC) in South Asia and Synthesis, a NASA LCLUC / SARI meeting held at Ashoka University on 9–11 April 2024, where it received 3rd prize.
Motivation
Widespread, repeated damage within cities is a hallmark of modern, increasingly urbanised warfare. Knowing where that damage is matters for protecting civilians, directing humanitarian relief, and documenting what happened. But conflict is exactly when information is hardest to get: networks are censored, cut off or physically destroyed, and aid organisations, governments and families alike struggle to establish what is happening on the ground.
Gaza is an extreme case. Its only fibre-optic connection to the global internet runs through Israel; Israeli authorities control the radio spectrum available to Palestinian operators and must approve imports of telecommunications equipment, much of which has been denied as “dual-use”. At the time of this project, mobile networks in Gaza were still 2G. When communication from the ground is this fragile, remote sensing becomes one of the few independent sources of information.
Why radar?
Optical satellite imagery is the obvious starting point, but it has two problems here.
- It needs clear skies and daylight. Optical sensors are passive: they record reflected sunlight, so clouds, smoke and night block them. Synthetic aperture radar (SAR) is an active sensor: it emits its own microwave pulses and records the echo. At the centimetre-scale wavelengths it uses (Sentinel-1’s C-band is about 5.6 cm), the signal passes through cloud cover and works day or night, so acquisitions arrive on a regular schedule regardless of the weather.
- It is weak at seeing structural change from above. Looking straight down (nadir), a partly collapsed building can look almost the same as an intact one, because the roof outline barely changes. Radar, by contrast, is sensitive to the geometry of the surfaces that scatter its signal. When a building partially collapses, the scatterers move, and the phase of the returned signal changes.
Background: interferometry and coherence
A SAR image is complex-valued: every pixel has an amplitude (how strongly the signal was scattered back) and a phase. Interferometric SAR (InSAR) compares the phase of two acquisitions of the same area taken from nearly the same orbital position. It is widely used to measure topography and ground deformation, for example after earthquakes.
For damage mapping, the key quantity is the interferometric coherence $\gamma$, which measures how similar the scattering in a small window is between the two acquisitions $s_1$ and $s_2$:
$$\gamma = \frac{\left|\langle s_1 s_2^{*} \rangle\right|}{\sqrt{\langle |s_1|^2 \rangle \langle |s_2|^2 \rangle}}, \qquad 0 \le \gamma \le 1$$
where $\langle \cdot \rangle$ is an average over neighbouring pixels. A coherence near 1 means the scatterers stayed stable; near 0 means they changed. Built-up areas are normally highly coherent, since buildings don’t move. Coherent change detection therefore looks for areas that were coherent before an event and lose coherence across it.
Data and method
Data. I used Sentinel-1 C-band SAR data from the European Space Agency. After Sentinel-1B failed in December 2021, Sentinel-1A operated alone in 2023 on a 12-day repeat cycle, which set the time resolution of the analysis. I selected two interferometric pairs on the Alaska Satellite Facility and processed them there into coherence products with ASF’s on-demand InSAR service (HyP3):
| Pair | Dates (2023) | Role |
|---|---|---|
| Pre-event | 30 September – 12 October | baseline coherence of the city |
| Event | 12 October – 24 October | spans the first weeks of bombardment |
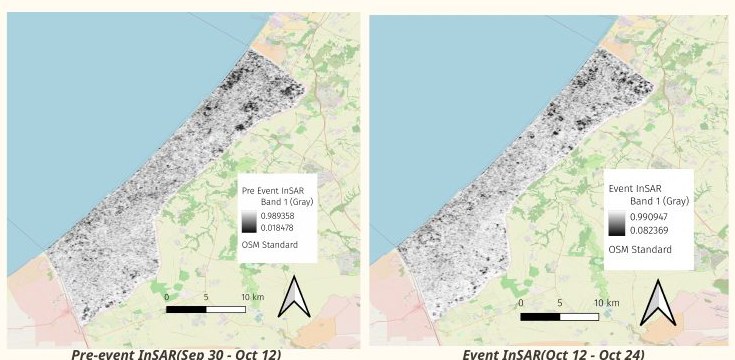
Processing (QGIS).
- Change in coherence. Using the raster calculator, I computed the relative change in coherence for every pixel: $$\Delta\gamma = \frac{\gamma_{\text{event}} - \gamma_{\text{pre-event}}}{\gamma_{\text{pre-event}}}$$
- Keep only decreases. Pixels where coherence increased ($\Delta\gamma > 0$) were masked out, since the signal of interest is a loss of coherence.
- Keep only stable areas. To suppress noise from vegetation, environmental conditions and other changes unrelated to damage, I masked out every pixel whose pre-event coherence was below a strict threshold of 0.9. Only areas that were very stable before the event can then register as “changed”.
- Damage proxy map. The remaining pixels, which went from high coherence to low, form the damage proxy map. I styled them with a single-band pseudocolour ramp and overlaid them on a basemap, together with municipal boundaries, closed and access-restricted areas, and landmarks reported in the news.
The hypothesis was that structural damage mapped from InSAR coherence would agree with media and civilian reports from the same period.
Results
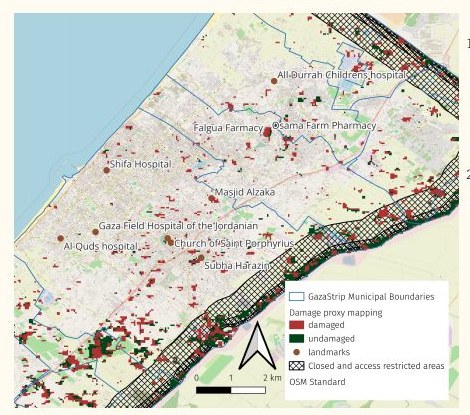
- Coherence loss along the perimeter. Coherence dropped along the roughly 60 km Israeli-controlled fence to the north and east of the Gaza Strip, and within the adjacent closed buffer zone. This is consistent with military activity along the perimeter in the lead-up to the ground invasion: Planet Labs imagery showed around 400 military vehicles massed in Israel near northern Gaza, and on 31 October the New York Times published a detailed satellite view of the invasion.
- Coherence loss in both the north and the south. Coherence decreased in Gaza City in the north and around Khan Younis in the south. In the north, this plausibly reflects structural damage from airstrikes. In the south, the same signal may instead reflect the rapid construction of large displacement camps, as residents moved south following Israeli evacuation orders. Coherence loss alone cannot distinguish the two.
To assess the hypothesis qualitatively, I geo-referenced sites reported in the news during this period, including Al-Shifa Hospital, Al-Quds Hospital (ordered to evacuate on 14 October), and the Church of Saint Porphyrius, struck on 20 October, and compared them against the damage proxy map.
Limitations
- Coherence loss is a proxy, not a damage label. Decorrelation also comes from vegetation change, construction, new tents and shelters, soil disturbance, and simply the time between acquisitions. That’s why the output is a damage proxy map, and why results like the southern signal are ambiguous.
- Validation was qualitative. I compared the map against media reports rather than against independent ground-truth damage assessments, so I can’t give detection or false-positive rates.
- A single snapshot. One event pair captures a 12-day window. A time series of pairs would show how damage accumulates.
- Possible improvements:
- stricter masking of low-coherence areas in the pre-event scenes;
- choosing pairs with matching temporal baselines, so differences in temporal decorrelation don’t masquerade as change;
- choosing pairs with small perpendicular baselines, to reduce geometric decorrelation.
Related work
This project follows the approach taught in NASA ARSET’s training on monitoring urban damage during humanitarian conflict, and builds on work by Jamon Van Den Hoek (Oregon State University) and Corey Scher (CUNY Graduate Center), who have mapped damage in Gaza with Sentinel-1 coherence. Their later preprint shows what this method can do at scale: using Sentinel-1 coherence with a long temporal-arc coherent change detection approach, they tracked weekly damage across the Gaza Strip during the first year of the war, detecting 92.5% of UN damage labels with a 1.2% false-positive rate, and estimated that about three-fifths of all buildings had been damaged or destroyed. Similar InSAR and optical approaches have been applied to Mosul, Mariupol and Kyiv.
References
- NASA ARSET. Monitoring Urban Damage during Humanitarian Conflict (training).
- Flores-Anderson, A. I., Herndon, K. E., Thapa, R. B., Cherrington, E. (eds.). The SAR Handbook: Comprehensive Methodologies for Forest Monitoring and Biomass Estimation. SERVIR / NASA, 2019.
- Scher, C., Van Den Hoek, J. Active InSAR monitoring of building damage in Gaza during the Israel-Hamas War. arXiv:2506.14730, 2025.
- Post-War Urban Damage Mapping Using InSAR: The Case of Mosul City in Iraq. ISPRS International Journal of Geo-Information 10(3):140, 2021.
- Huang, Q., Jin, G., Xiong, X., Ye, H., Xie, Y. Monitoring Urban Change in Conflict from the Perspective of Optical and SAR Satellites: The Case of Mariupol. Remote Sensing 15(12):3096, 2023.
- War-Related Building Damage Assessment in Kyiv, Ukraine, Using Sentinel-1 Radar and Sentinel-2 Optical Images.
- Alaska Satellite Facility, HyP3 InSAR product guide.
- NASA Earthdata, What is Synthetic Aperture Radar?